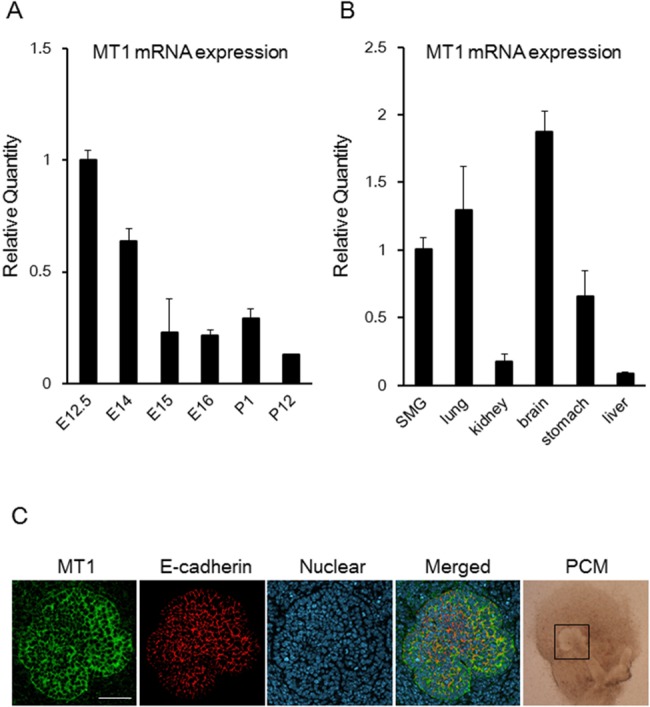
Fig 1. MT1 mRNA Expression and localization of MT1 and E-cadherin in the submandibular gland of the embryonic mouse.

The expression of MT1 mRNA was determined by qPCR analysis (A, B). MT1 mRNA expression levels in E14, E15, E16, P1, and P12 were normalized to that in E12.5 (A). MT1 mRNA expression levels in the lung, kidney, brain, stomach, and liver were normalized to that in the SMG (B). Bars represent the mean ± SEM. MT1 expression during branching morphogenesis was shown by confocal immunofluorescence microscopy imaging of staining for MT1, E-cadherin, or nuclei. MT1 was expressed at the epithelial plasma membrane (C). The three fluorescence images of the same confocal section are merged. The phase-contrast microscope (PCM) image supports the existence of epithelial buds (open square), indicating the morphology of the whole SMG. Scale bar: 50 μm.
