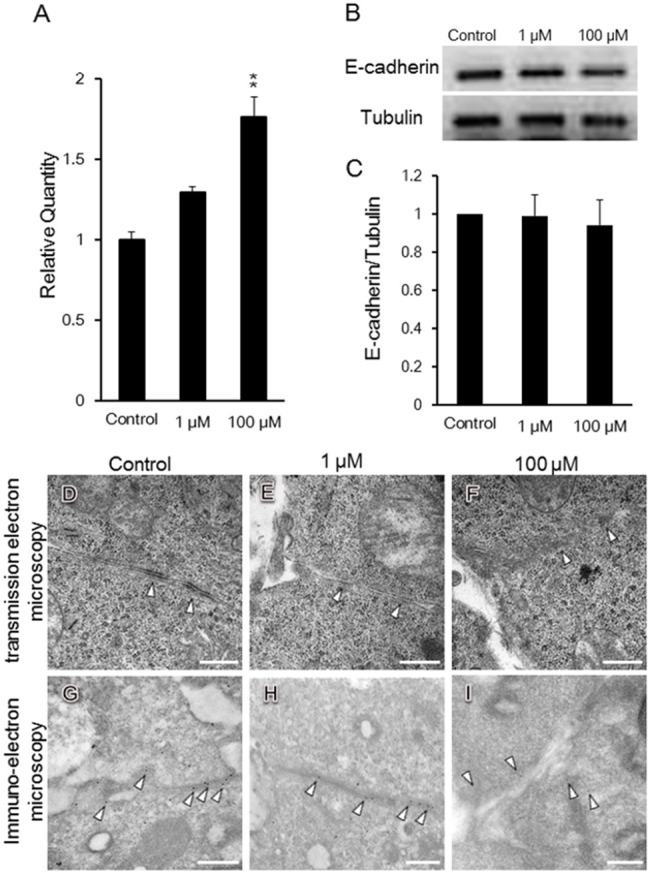
Fig 5. Expression and localization of E-cadherin in the presence of melatonin.

E-cadherin mRNA expression levels were analyzed. E-cadherin mRNA expression levels in SMG cultured with 1 μM and 100 μM melatonin were normalized to that in control SMG without melatonin (n = 3) (A). The expression of E-cadherin protein was analyzed by Western blot. The study was repeated three times, with data shown from a representative experiment (B). The band intensity was quantitated (n = 3) (C). The adherence junction is shown in the presence of melatonin by TEM (D, E, F). The localization of E-cadherin was shown in the presence of melatonin by immuno-electron microscopy (G, H, I). Scale bar: 500 nm. Bars represent the mean ± SEM. **p < 0.01 compared with control.
