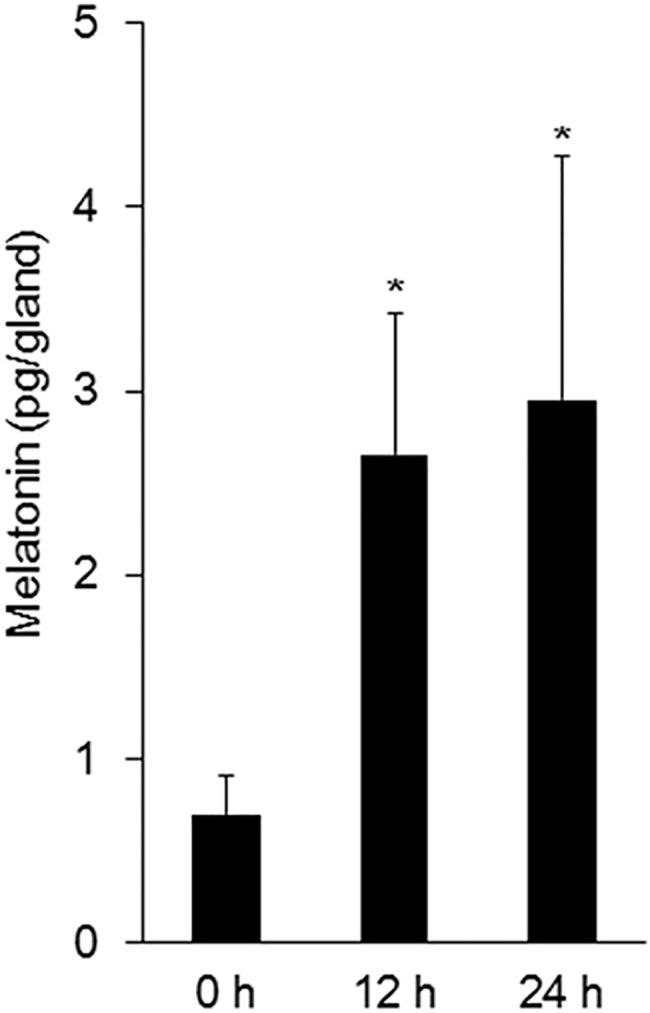
Fig 6. Production of melatonin by embryonic submandibular glands.

In C3H mice, the total amount of melatonin in the SMGs and culture medium are shown. Bars represent the mean ± SEM. *p < 0.05 compared with control.

In C3H mice, the total amount of melatonin in the SMGs and culture medium are shown. Bars represent the mean ± SEM. *p < 0.05 compared with control.