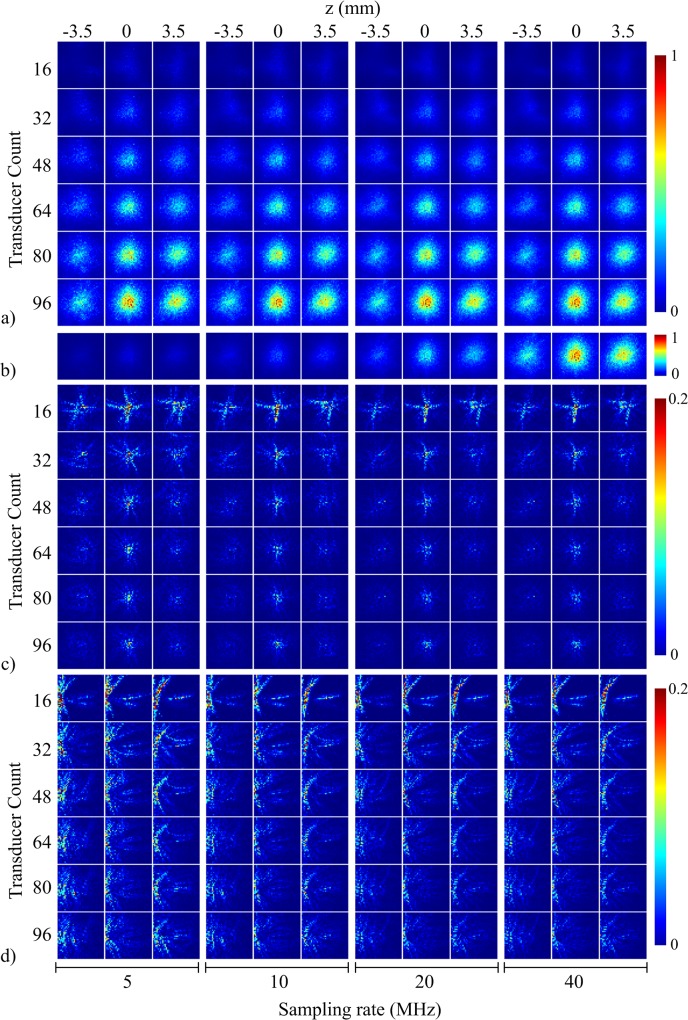
Fig 2. System sensitivity and aliasing as a function of transducer count and sampling rate.
(a) System sensitivity maps of the xy-plane 3.5 mm below center (left column), center plane (middle column), and xy-plane 3.5 mm above center (right column) as a function of transducer count and sampling rate. Maps were normalized to peak system sensitivity per sampling rate. (b) System sensitivity maps showing last row of (a) (96 transducers) normalized to peak system sensitivity across sampling rates. (c) Aliasing maps for the center voxel as a function of transducer count and sampling rate. Planes correspond to those shown in (a). Maps were normalized to peak system sensitivity per sampling rate and per transducer count and then scaled to 20% max for display purposes. (d) Same as (c) but for aliasing for a voxel near the edge of object space.

