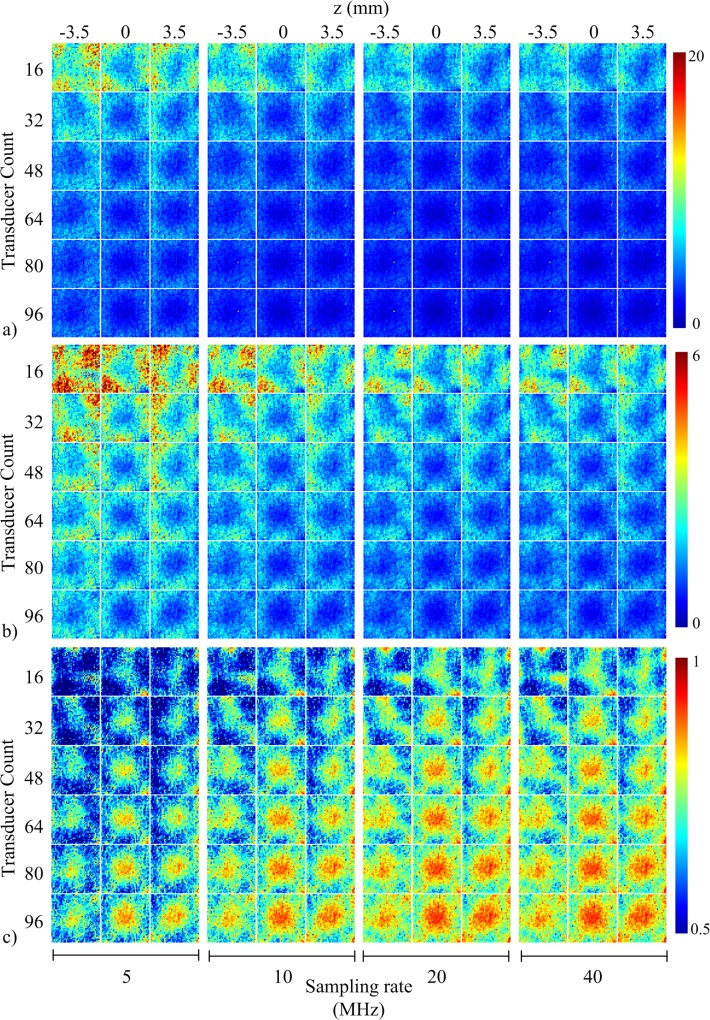
Fig 4. Metric maps for system performance as a function of transducer count and sampling rate.
Metric maps for (a) RMSE, (b) MAE, and (c) 3D-SSIM displayed as a function of transducer count and sampling rate in the xy-plane 3.5 mm below center (left column), center plane (middle column), and xy-plane 3.5 mm above center (right column).

