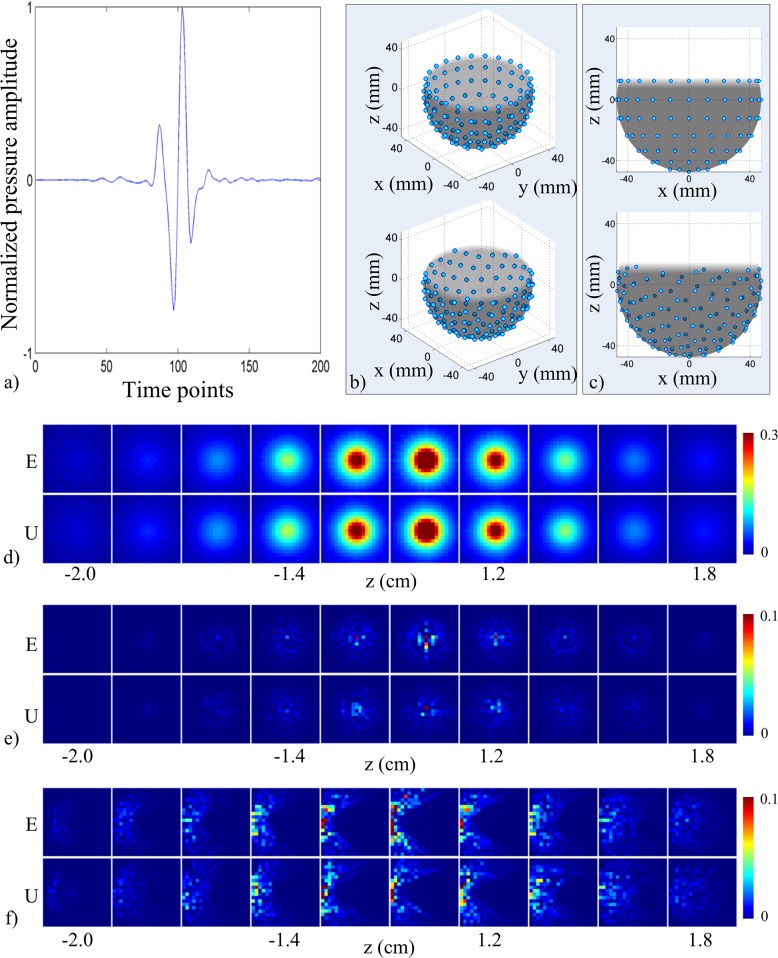
Fig 5. System sensitivity and aliasing for the experimental transducer arrangement and uniform sampling arrangement.
(a) Transducer response profile to a PA point source (~100 μm) averaged over 64000 triggers acquired with one transducer at a 40 MHz sampling rate. The amplitude represents the counts on the digital-to-analog converter and has been normalized to the maximum sensitivity. (b) Point cloud representations of the experimental transducer arrangement (top) and uniform sampling arrangement (bottom). Darker shaded area represents exterior of shell closest to reader. Lighter shaded area represents interior surface of the shell. (c) Same as (b) from a side-view. (d) Normalized sensitivity maps for the two arrangements and scaled to 30% max sensitivity for display purposes. Aliasing maps for the center voxel (e) and a voxel along the left edge (f) shown for the two arrangements (experimental transducer arrangement in the top row and uniform sampling arrangement in the bottom row). Each arrangement was independently normalized and scaled to 10% max for display purposes. The image planes are 2 x 2 cm2 and correspond to every other xy-plane of object space (left to right corresponds to bottom (z = -2 cm) to top (z = 1.8 cm) planes at 2 mm step size).

