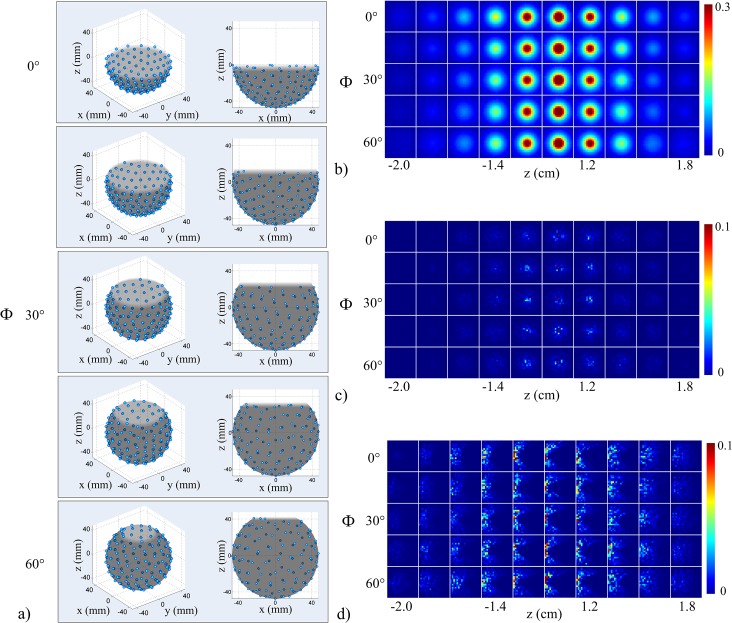
Fig 6. System sensitivity and aliasing as a function of array angular coverage.
(a) Point cloud representations of transducer arrays as a function of array angular coverage (top to bottom corresponds to 0° to 60°). Side views are shown in the right-hand column. (b) Normalized sensitivity maps (scaled to 30% max for display purposes) for each array coverage angle (top to bottom row corresponds to 0° to 60°). (c) Independently normalized aliasing maps (scaled to 10% max for display purposes) for the center voxel and left edge voxel (d) for each array coverage angle. Image planes correspond with those in Fig 5.

