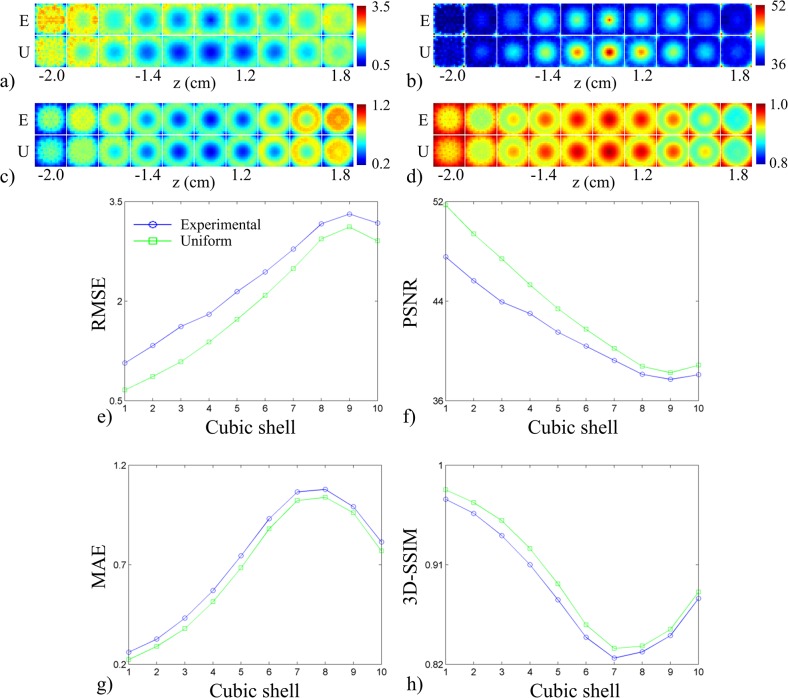
Fig 8. Effects of transducer arrangement on system performance.
Metric maps for (a) RMSE, (b) PSNR, (c) MAE, and (d) 3D-SSIM displayed for both experimental transducer arrangement (top row) and uniform sampling arrangement (bottom row). (e)-(h) System performance figures of merit (RMSE, PSNR, MAE, and 3D-SSIM reading clockwise starting from top left panel) plotted as a function of cube contours for the two arrangements (legend shown in panel (e)).

