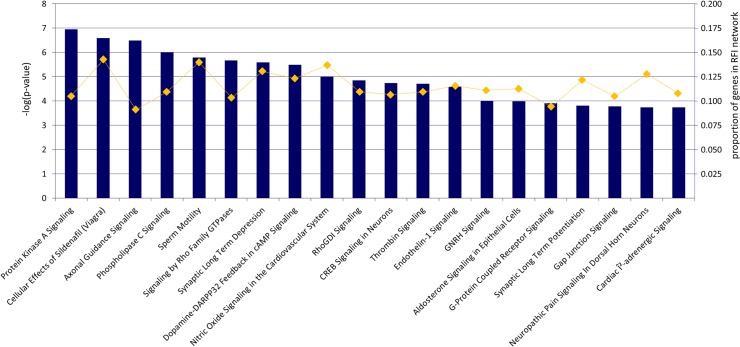
Fig 4. Overview over the most highly enriched canonical pathways in the feed efficiency network.
Bars represent canonical pathways as labeled. The lengths of the bars reflect the strength of association [-log(pvalue)]. In total, the feed efficiency network was significantly enriched for 102 canonical pathways [-log(pvalue) ≥ 1.3]. A summary of all significantly enriched canonical pathways is given in S5 Table. Canonical pathways were determined with the Ingenuity Pathway Analysis tool (IPA). As input for the analysis served all 936 genes from the feed efficiency network that could successfully be annotated by IPA. Correction for multiple testing was carried out via a Fisher’s exact test as implemented in IPA.

