
Figure 4.
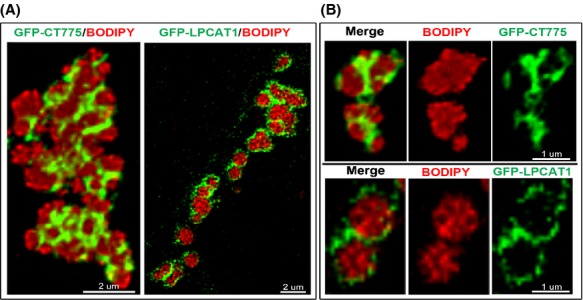
CT775 and hLPCAT1 enzymes are bound to LDs. HeLa cells were grown on coverslips and transfected with GFP-CT775 or with GFP-LPCAT1 (green) for 48 h. LDs production was induced by addition of oleic acid in the growth medium for 24 h and LDs were labeled in vivo for 1 h with BODIPY C12 (red). After cell fixation in 4% paraformaldehyde, DNA was stained with the Hoechst dye (blue). Deconvolved Z-stack merged images of GFP-CT775 and BODIPY and of GFP-LPCAT1 and BODIPY, respectively, are shown in (A). A cropped section of each image showing two LDs is displayed in (B). The merged, and the two single channel views, are presented for CT775 (top) and for hLPCAT1 (bottom). Quantification analysis determined that 75% of GFP-CT775 and 93% of GFP-LPCAT1 co-localized with the BODIPY signal with a tMCC of 0.8969 and of 0.7130, respectively. LDs, lipid droplets; tMCC, thresholded Manders’ colocalization coefficients.