
Figure 7.
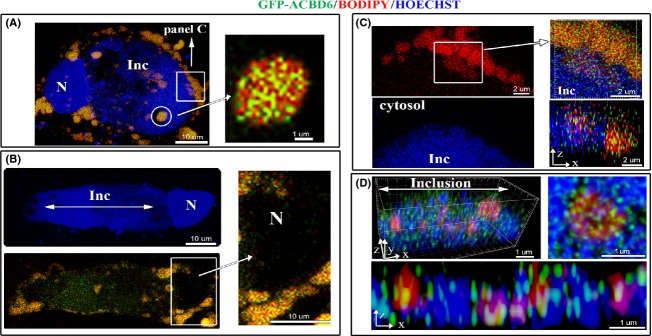
Relocation of hACBD6 to LDs and into the inclusion during Chlamydia development. HeLa cells were grown on coverslips, infected with C. trachomatis 6 h prior transfection with GFP-ACBD6. LDs production was induced by addition of oleic acid in the growth medium for 24 h and LDs were labeled with BODIPY C12 (red). After cell fixation in 4% paraformaldehyde, DNA was stained with Hoechst dye (blue). Nuclei and inclusion are indicated with N and Inc, respectively. (A) A merged image of an infected cell accumulating LDs with a single large inclusion. Note that in the cytosol, the GFP signal overlaid with the BODIPY signal. Inset: cropped view of a deconvolved Z-stack merge image of a lipid droplet associated with GFP-ACBD6 (92% co-localization with a tMCC of 0.9411). (B) An infected cell with a large inclusion is shown in the single blue channel (Hoechst staining, top) and is shown as a merged image of the signal of GFP-ACBD6 and BODIPY (green and red, bottom). Note the detection of the GFP signal in the lumen of the inclusion. Inset: cropped view showing the absence of the GFP signal in the nucleus of the infected cell. (C) A cropped view of a section of the cell shown on (A) which captured the apparent migration of the LDs (red signal) inside the large inclusion (blue area). Cropped orthogonal views confirmed that the GFP and BODIPY signal were detected overlaid on the cytosolic side surrounding the inclusion as well as in the lumen of the inclusion. (D) Cropped orthogonal x, y, z view of the inside of an inclusion is shown as a merge image of the Chlamydia chromosome (blue), lipid droplets (red) and ACBD6 (green). A x, z view is shown at the bottom and a cropped view of a single LDs with bound GFP-ACBD6 inside the inclusion is shown on the right (91% co-localization with a tMCC of 0.9282). LDs, lipid droplets.