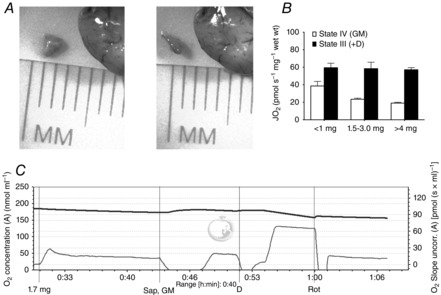
Figure 1. Optimizing sample size.

A, dimensions of an ∼2 mg sample of cortex. B, sample sizes <1 mg show an impaired ability to detect changes in respiration, where samples >4 mg show prominent diffusion limitations. C, typical GM trace for a 1.7 mg sample followed by complex I inhibition with rotenone; oxygen concentration nmol ml–1 (top thick line) and oxygen consumption (pmol (s × ml)–1 (bottom thin line). D, ADP; GM, glutamate; Rot, rotenone; Sap, saponin.
