
Figure 3. Whole cell recording from the intact superior cervical ganglion reveals neurons with class 1 and class 2 firing dynamics.
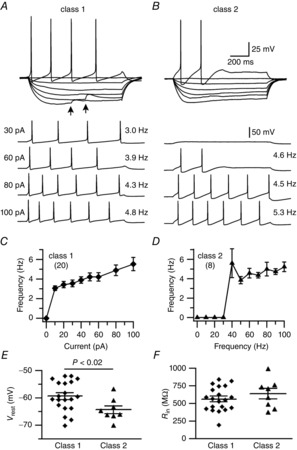
A, example of a current–voltage relation from a sympathetic neuron with class 1 firing dynamics. Upward arrows point to spontaneous nicotinic EPSPs. The firing rate of this cell was smoothly graded over the range of currents tested. B, example of current–voltage relation from a cell with class 2 firing dynamics. Unlike the cell in (A), this cell did not fire in response to a 30 pA current pulse and adapted in response to the 60 pA stimulus. C, plot of the frequency–current relation for 20 neurons with class 1 firing dynamics. Note that this group of cells fired in response to 10 pA stimuli. D, plot of the frequency–current relation for eight neurons with class 2 firing dynamics. In these cells, the current threshold for firing was 40 pA, firing adapted during responses to weaker stimuli and the firing rate was more insensitive to the current strength than in class 1 cells. E, average Vrest of class 1 neurons was significantly less than in cells with class 2 firing dynamics, but the range for individual cells overlapped. F, average Rin was indistinguishable in neurons with class 1 and class 2 firing dynamics. Note that many of the cells in both groups had Rin in the range 500 MΩ–1 GΩ.