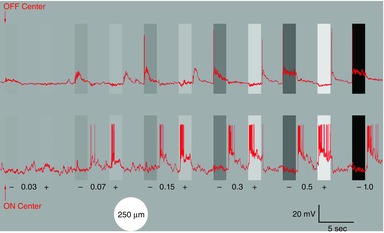
Figure 1. Contrast series.

The two retinal ganglion cells (red traces; OFF-centre cell upper trace, ON-centre cell lower trace) were stimulated with a 2 s light stimulus, 250 μm in diameter at different contrast levels (0.03, 0.07, 0.15, 0.3, 0.5, and 1.0 log unit) against a steady background light of 9 lux. For each magnitude of the contrast displayed, the negative contrast (darker bar) precedes the positive contrast (lighter bar) stimulus. The first 5 s of each stimulus is displayed (of a 20 s interstimulus interval); the positive 1.0 log unit contrast is not shown. Arrows indicate the onset of the first stimulus because this low contrast step is difficult to discern from the background.
