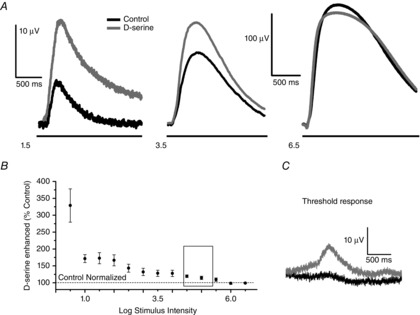
Figure 4. Flash intensity coding revealed through the PNFP illustrates that sensitivity to d-serine decreases as the flash intensity is increased.

The PNFP was recorded over a range of 6 log units using 2 s flashes of light of increasing intensity; the interflash interval was 25 s. A, initial intensity series under control conditions (black traces) shown for intensities 1.5, 3.5 and 6.5, followed by an identical series in the presence of 100 μm d-serine (grey traces). B, for each intensity, the control was normalized to 100% (dashed line near bottom of the figure), whereas the response in the presence of d-serine is indicated by the filled circles, including the SEM (n = 6). Inset: range over which the adaption experiments explored the contrast sensitivity shown in Fig.2. C, example of a ‘threshold response’. In the presence of d-serine, a PNFP response was obtained at 0.5 log I when an insignificant response to light was observed under control conditions.
