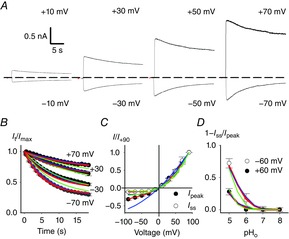
Figure 5. Voltage dependency of inactivation in WT CNGA1 channel.

A, current recordings at pHo 5 from the same inside-out patch at the indicated membrane potentials in symmetrical Na+. Currents were evoked by 1 mm cGMP. Dashed line indicates the 0 current level. B, time course of inactivation It/Imax at pHo 5 for the indicated membrane potentials from experiments as in A where sampling points were averaged every 500 μs. Each current decay was obtained from at least three independent experiments. Imax was measured at the peak of the cGMP current. C, dependence of the cGMP-activated current on membrane voltage prior to current decline (black circles) and after completion of inactivation (white circles). Current was scaled to the current flowing at +90 mV. D, dependence of fractional inactivation (1 – Iss)/Ipeak at + 60 mV (white dots) and −60 mV (black dots) on pHo. Ipeak and Iss were measured at the beginning and termination of the cGMP pulse, respectively. Blue, green and red lines refer to simultaneous fits of all the data with schemes i, ii, and iii shown in Fig.6A, respectively. For scheme i association constant B(0) was 1.59 × 10⁴ m−1 (pKa 4.2). The electrical distance δB was 0.37. The forward (i+) and backward (i–) inactivation rate constants were 0.41 and 0.05 s−1, respectively. For scheme ii association constants B(0)1 and B(0)2 were 2.8 × 10⁵ m−1 (pKa 5.44) and 2.5 × 10⁴ m−1 (pKa 4.4), respectively. The electrical distance δB was 0.22. The forward (i+) and backward (i–) inactivation rate constants were 0.51 and 0.035 s−1, respectively. For scheme iii association constants P(0), B(0)1 and B(0)2 were 1.59 × 10⁴ m−1 (pKa 4.2), 1.25 × 10⁶ m−1 (pKa 6.1) and 5 × 10⁴ m−1 (pKa 4.7), respectively. The electrical distances δP and δBi were 0.37 and 0.45, respectively. The forward (i+) and backward (i–) inactivation rate constants were 0.41 and 0.05 s−1, respectively.
