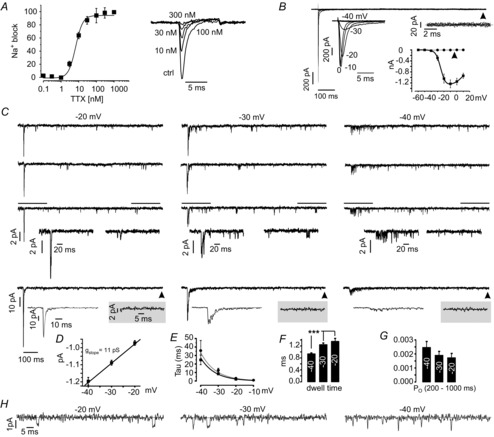
Figure 2. Nav channels in MCCs are transient and fully blocked by TTX.

A, TTX dose–response curve representing the mean of 11 cells, fitted by a sigmoidal function with IC50 = 7 nm. Traces are normalized against control values. Currents were triggered by step depolarizations to −10 mV from Vh = −70 mV every 5 s. B, whole-cell Nav currents after subtraction of TTX-insensitive currents evoked by depolarizing pulses lasting 1 s in steps of 10 mV from Vh = −70 mV (n = 8). Left inset: transient segment of Nav currents at an expanded time scale. Right inset: an enlargement of the current at steady-state indicated by the arrow. Bottom inset: I/V relationship for the transient component (continuous line) and the steady-state component (dotted line). C, three representative single channel traces recorded from perforated microvesicles pulled off from six MCCs at −20, −30 and −40 mV. Bottom trace represents the ensemble currents obtained by summing-up 10 consecutive single channel traces. Decay of the ensemble currents were fitted by a single exponential function (grey line superimposing the current trace). Grey windows show ensemble currents at steady-state indicated by the arrow. D, single channel slope conductance obtained by linear fit through the mean unitary current amplitudes estimated within the last 800 ms of the recording at −40 mV (226 openings), −30 mV (243 openings) and −20 mV (111 openings). F, time constants of Nav current inactivation for whole-cell currents (referred to B, thick line) and ensemble currents (referred to C, dotted line) obtained from single exponential fits. F, single channel mean dwell times for the indicated potentials, starting at Vh = −70 mV. G, estimated mean open probability of Nav channels during the steady state normalized to the total amount of channels in the patch. H, Single channel traces obtained at the indicated test potentials at expanded time scale (100 ms).
