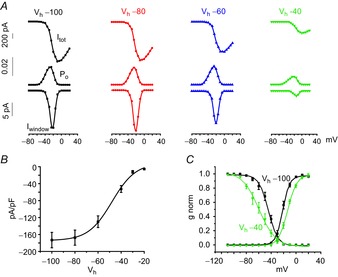
Figure 4. Holding potential dependent reduction of window currents and channel availability in MCCs.

A, top: whole-cell currents; middle: open probabilities (Po) obtained by multiplying activation and inactivation curves shown in Fig.3c; bottom: window currents calculated by multiplying the whole-cell currents (top) by Po (middle). The Vh values of the experiment are indicated at the top: −100 mV (black), −80 mV (red), −60 mV (blue) and −40 mV (green). B, availability of Nav current densities with respect to the indicated holding potentials (n = 26). Data were fit by a Boltzmann equation. The half-maximal value and slope factor of inactivation are −47.9 mV and 10.5 mV. C, overlap of activation and inactivation curves at Vh = −100 mV (black) and Vh = −40 mV (green), derived from Fig.3.
