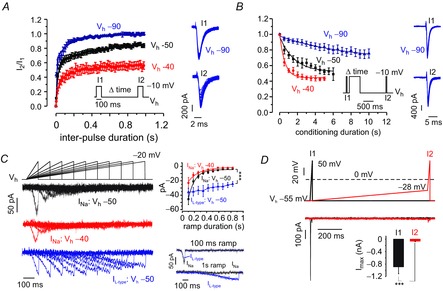
Figure 5. Inactivation properties of MCC Nav channels.

A, recovery from steady-state inactivation of Nav currents from Vh = −90 mV (blue, n = 13), −50 mV (black, n = 14) and −40 mV (red, n = 10). Current amplitudes at the test pulse (I2) were normalized against current amplitudes at the preceding pulse (I1). Averaged data were fit by double exponentials with fast and slow components of different amplitude (Afast, Aslow) and time constants (τfast, τslow). τfast, τslow and amplitudes (in parenthesis) were: 4.8 ms (0.6) and 156 ms (0.4) at −90 mV, 21.3 ms (0.6) and 501 ms (0.3) at −50 mV, 23.7 ms (0,34) and 229 ms (0.22) at −40 mV. B, onset of closed-state slow inactivation during Vh = −90 mV (blue, n = 10), −50 mV (black, n = 5) and −40 mV (red, n = 6). Current amplitudes during the test pulse (I2) were compared with currents at onset (I1). The conditioning pulse was followed by a recovery period of 1.2 s to allow recovery from fast inactivation. Data were fit by a single exponential function of different time constant (τ) and amplitude (A). τ and A (in parenthesis) were 7.8 s (0.32) at Vh = −90 mV, 1.6 s (0.45) at −50 mV and 0.58 s (0.54) at −40 mV. C, Nav and L-type currents elicited by ramp depolarizations starting from Vh = −50 mV (black) or Vh = −40 mV (red). Nav currents are the result of subtracting control traces from the TTX-resistant component. L-type currents (blue) are the results of subtracting control traces from nifedipine-insensitive currents. Inset to the right: mean ± SEM of peak Na+ and L-type currents at different ramp duration. D, comparison of Nav currents evoked by a 20 ms ramp in the presence (I2, red trace) or absence (I1, black trace) of a preceding slow pacemaker such as ramp of 1 s duration subsequent to the indicated protocol on top (***P < 0.001, paired Student's t test). The black and red voltage-clamp protocols indicated on top were separated by 5 s. The starting voltage of the ramp (−55 mV) is the mean AHP peak of the Aps, whereas −28 mV is the mean spike threshold value (Vandael et al. 2012).
