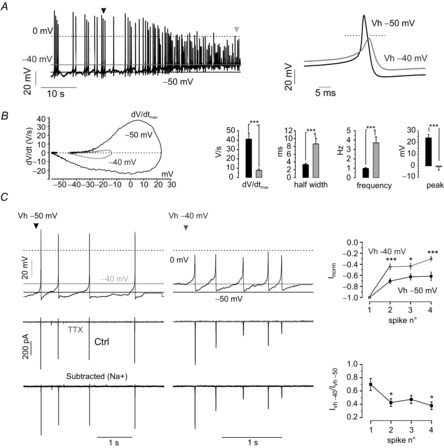
Figure 6. Chromaffin cell stimulation leads to Nav channel inactivation and AP widening.

A, representative response of a current clamped MCC to a 10 mV steady depolarization. Right: overlap of a control AP (black) with an AP obtained after the imposed depolarization (grey). B, Phase plane plots (dV/dt vs. V) from the same cell constructed by averaging n = 4 APs at Vh = −50 and n = 5 APs at −40 mV, respectively. Right: effects of a 10 mV depolarization on spike parameters (***P < 0.001, paired Student's t test). Half-width was measured as the duration of the AP at half of the total amplitude (from the after-hyperpolarization peak to overshoot peak). C, Nav currents measured by AP-clamp using APs at rest (left) and APs that originate from a depolarized resting potential (right). Middle: control trace in black and TTX (300 nm) resistant component in grey. Bottom: pure Nav currents after subtraction for TTX-insensitive currents. Top-right inset: normalized current amplitudes against the first current peak amplitude of the spike train. The grey line and dots refer to Nav currents triggered at depolarized resting potentials (−40 mV, n = 12), whereas the black line and squares represent Nav currents that flow during spikes at rest (n = 12) (*P < 0.05, ***P < 0.001, paired Student's t test). Bottom-right inset: the ratio between Nav currents triggered by control APs and APs at depolarized resting potentials for each consecutive spike (*P < 0.05, ANOVA followed by a post hoc Bonferroni analysis).
