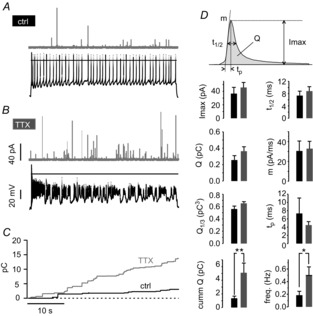
Figure 10. Burst firing associated with Nav channel blockade boosts MCC exocytosis.

A, example of combined recording of APs (black traces) and amperometric events (grey traces) by carbon fibre amperometry in the control. B, representation of combined recording of AP bursts after TTX application (same cell as shown in A) and amperometric events by amperometry. C, overlap of cumulative secretion plots obtained from amperometric measurements shown in A and B for control (black curve) and during TTX application (grey curve). D, comparison of amperometric spike parameters (see top), frequency and cumulative charge between control (black bars) and TTX-treated cells (grey bars) (*P < 0.05 and **P < 0.01, n = 14; paired Student's t test).
