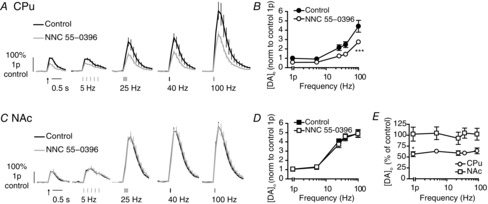
Figure 3. T-type voltage-gated Ca2+ channels modulate DA release in CPu but apparently not in NAc.

A and C, mean profiles of [DA]o ± SEM vs. time evoked by one or five pulses (5–100 Hz) in CPu (A) or NAc (C) in control or the presence of NNC 55-0396 (1 μm). Data are normalized to 1p peak [DA]o evoked in control conditions. Control conditions (black lines), NNC 55-0396 (grey lines). B and D, mean peak [DA]o ± SEM vs. frequency (5p) in CPu (B) and NAc (D) in control conditions (filled) or T-block (unfilled). Bonferroni post-test vs. control: ***P < 0.001. E, mean peak [DA]o ± SEM after voltage-gated Ca2+ channel block expressed as percentage of control at each frequency in CPu (circles) and NAc (squares) shows a greater effect in CPu than NAc. Bonferroni post-test: *P < 0.05, n = 3 animals. CPu, caudate putamen; DA, dopamine; NAc, nucleus accumbens.
