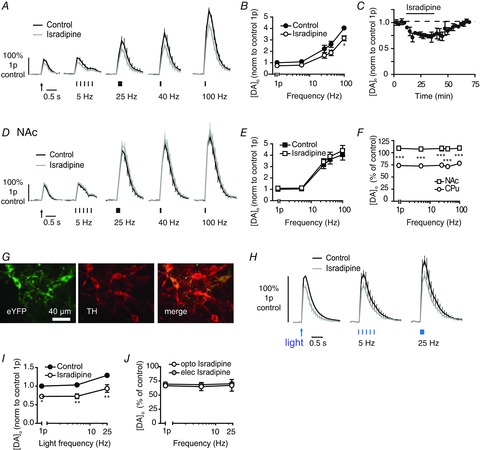
Figure 4. L-type voltage-gated Ca2+ channel blocker modulates DA release in CPu but apparently not NAc.

A and D, mean profiles of [DA]o ± SEM vs. time evoked by one or five electrical pulses (5–100 Hz) in CPu (A) or NAc (D) in controls or the presence of isradipine (5 μm). Data are normalized to 1p peak [DA]o evoked in control conditions. Control conditions (black lines), isradipine (grey lines). B and E, mean peak [DA]o ± SEM vs. frequency (5p) in CPu (B) and NAc (E) in control conditions (filled) or L-block (unfilled). Bonferroni post-test vs. control: *P < 0.05. C, mean peak [DA]o ± SEM evoked by a single pulse during wash-on (black bar) and wash-off of isradipine (5 μm). F, mean peak [DA]o ± SEM after voltage-gated Ca2+ channel block expressed as percentage of control at each frequency in CPu (circles) and NAc (squares) shows a significantly greater effect in CPu than NAc. Bonferroni post-test, CPu vs. NAc: ***P < 0.001, n = 3–4 animals. G, fluorescence images in substantia nigra pars compacta of ChR2-eYFP (left), anti-TH (middle) and merged images (right), showing expression of ChR2-eYFP restricted to TH-positive cells. Scale bar, 40 μm. H, mean profiles of [DA]o ± SEM vs. time evoked by one or five blue light pulses (5–25 Hz) in CPu of ChR2-expressing DAT-Cre mice in control and presence of isradipine (5 μm). Data are normalized to 1p peak [DA]o evoked in control conditions. Control conditions (black lines), isradipine (grey lines). I, mean peak [DA]o ± SEM vs. frequency (5p) of blue light pulses in CPu of ChR2-expressing DAT-Cre mice, in control conditions (filled) or L-block (unfilled). Bonferroni post-test vs. control: *P < 0.05, **P < 0.01, n = 3 animals. J, mean peak [DA]o ± SEM after L-block expressed as percentage of control at each frequency in CPu after electrical (filled) or optogenetic stimuli (unfilled). CPu, caudate putamen; DA, dopamine; NAc, nucleus accumbens.
