
Figure 8. Intracellular Ca2+ chelators reveal different Ca2+ dynamics in CPu and NAc.
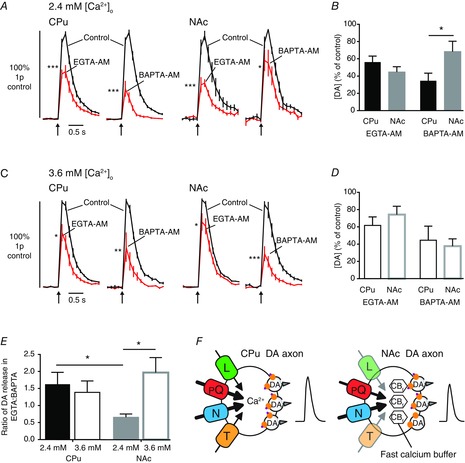
A and D, mean profiles of [DA]O ± SEM vs. time evoked by 1p for 2.4 mm [Ca2+]o (A) or 3.6 mm [Ca2+]o (C) in control conditions (black lines) and after incubation with EGTA-AM (100 μm) or BAPTA-AM (100 μm) (red lines). B and D, mean peak [DA]o ± SEM following EGTA-AM or BAPTA-AM incubation in 2.4 mm [Ca2+]o (B) or 3.6 mm [Ca2+]o (D). E, ratio of DA release in EGTA-AM:BAPTA-AM (expressed as a percentage of control ± SEM) in CPu (black) and NAc (grey) at 2.4 mm (filled) and 3.6 mm [Ca2+]o (unfilled). Bonferroni post-tests vs. control: *P < 0.05, **P < 0.01, ***P < 0.001, n = 7–10 sites per region, n = 3–4 animals. F, schematic summary depicting the relative regulation of DA transmission by different voltage-gated Ca2+ channels and Ca2+ in CPu versus NAc. Arrow weight and channel opacity indicate relative role of voltage-gated Ca2+ channels, CBf indicates an apparent additional fast Ca2+ buffer. CPu, caudate putamen; DA, dopamine; NAc, nucleus accumbens.