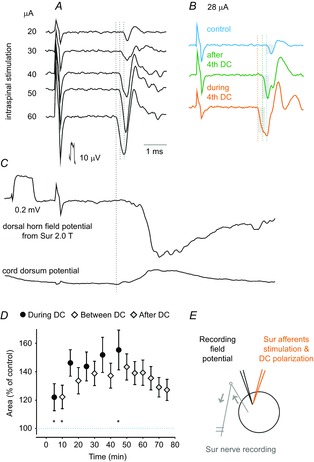
Figure 1. Comparison of excitability of cutaneous afferents before, during and after cathodal DC polarization in the rat.

A, records of antidromic volleys evoked in Sur afferent fibres after intraspinal stimuli of increasing intensities (20–60 μA) before DC polarization. Averages of 20 records. B, as in A but before, during and after DC polarization, as indicated, using 28 μA to evoke the volleys. C, field potential evoked by Sur stimulation at the site where the intraspinal stimuli were applied and the corresponding record from the cord dorsum. Vertical horizontal lines in B indicate latencies of antidromic volleys evoked during, after and before DC polarization corresponding to latencies of antidromic volleys evoked by 20, 40 and 60 μA in the series of records in A, with the shortest ones corresponding to the latency of the afferent volley recorded from the cord dorsum. In this and subsequent figures, negativity is up for records from the peripheral nerves and cord dorsum and down in microelectrode records (extracellular records of field potentials or intracellular). D, mean areas of the antidromic volleys in 8 sural nerves during successive polarization, between polarization and post polarization periods. Values (mean ± sem) are expressed as a percentage of the mean control area (i.e. the area of the volley recorded prior to the first polarization). E, the recording, stimulation, and polarization sites. Arrows indicate the direction of the neural traffic. For the comparison in D, repeated measures ANOVA indicated a significant effect (P = 0.0073; F14,98 = 2.35); Tukey's post hoc HSD test revealed significant differences between the last period of polarization (45 min) and the first two periods (5 min, P = 0.014; 10 min, P = 0.0016). A one-sample t test revealed that the first point (5 min) is significantly larger than the control, P = 0.02. Because this point showed the lowest values, the conclusion applies to all data points.
