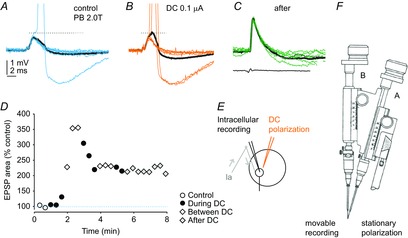
Figure 3. Increase in monosynaptic EPSPs from group Ia afferents during and after the first period of cathodal polarization in the PBST motor nucleus in the cat.

A, records of EPSPs and the only action potential evoked in a PB motoneuron by stimulation of the PB nerve at 2 times threshold for group I afferents during the last control series. Black trace, average of 20 records. Blue traces, a selection of single records illustrating a small range of amplitudes of EPSPs. B, EPSPs evoked at the end of the 1st period of cathodal polarization (0.1 μA, at 100 μm distance from the tip of the micropipette). Black trace, average of 20 EPSPs. Orange traces, EPSPs of the same amplitude as the control EPSPs but giving rise to action potentials at a shorter latency than in A. C, EPSPs evoked at the end of the first between-polarization period when action potential were no longer initiated; bottom trace, incoming afferent volleys recorded from the cord dorsum. Black trace, average of 20 EPSPs. Green traces, EPSPs illustrating a small range of their amplitudes. Action potentials in A and B are truncated. Dotted lines indicate the threshold for generation of action potentials. Voltage and time calibrations in A are for all records. D, areas of the average EPSPs (within 1 ms from their onset) during the control period and during the cathodal polarization, between polarization and post-polarization periods, as indicated. E, stimulation and recording sites. Arrows indicate the directions of the neural traffic. F, the double manipulator (Engberg et al. 1972). In the illustrated experiment, the tungsten electrode was held in the stationary drive (A) and the glass microelectrode was held in the movable drive (B).
