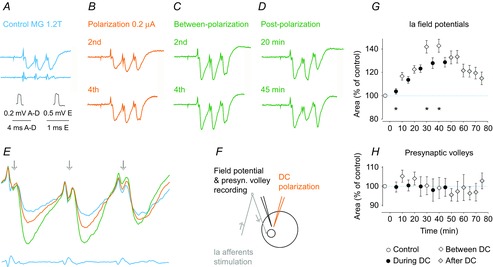
Figure 5. Facilitation of monosynaptic field potentials from group Ia afferents in a motor nucleus in the cat.

A–D, averaged records (n = 20) of field potentials evoked by submaximal stimulation of group I afferents in the MG nerve. They were evoked before, during and after cathodal polarization (0.2 μA), applied as indicated in F. In A, they are accompanied by records of afferent volleys from the cord dorsum (bottom trace). E, superimposed expanded records of control field potentials and of those evoked during and after the 4th period of polarization. Note that the field potentials are increased but the presynaptic volleys that preceded them (arrows) were not. F, stimulation and recording sites with arrows indicating the direction of the nervous traffic. G, time course of changes in the whole sample of 9 field potentials tested. Values (mean ± sem) are expressed as a percentage of control (i.e. the area of the potentials recorded prior to the first polarization). Repeated measures ANOVA indicated a statistically significant effect (P = 0.006; F14,98 = 3.05); Tukey's post hoc HSD test revealed significant differences between field potentials evoked 30 and 40 min from the beginning of the DC polarization (P = 0.021 and P = 0.0014, respectively) and during the first period of the polarization (5 min). H, mean changes in presynaptic volleys preceding 9 field potentials; all were evoked by the first stimulus in a train of stimuli. Repeated measures ANOVA did not reveal any statistically significant differences.
