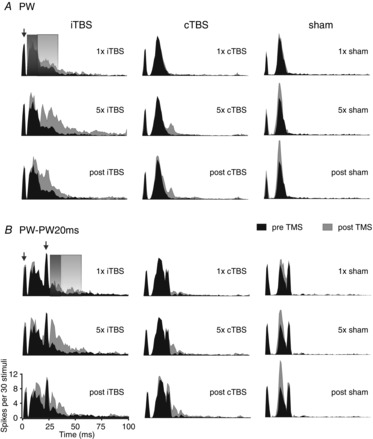
Figure 2. Changes in the dynamics of sensory MUA after theta-burst TMS.

Peri-stimulus time histograms (PSTHs) show grand average MUA of sensory responses for experiments with either iTBS application (left column, mean of 28 recording sites), cTBS (middle column, 34 recording sites) or sham stimulation (right column, 23 recording sites). Black areas always show pre-TMS activity while grey areas show responses after one block of stimulation (upper panels, ‘1 × iTBS, cTBS or sham’), after five blocks of stimulation (middle panels, ‘5× …’) or 60–120 min after the last TMS block had been applied (lower panels, ‘post …’; post1 and post2 recording sessions averaged). A, responses obtained with a single deflection of the principal whisker (PW); B, responses obtained with 2-fold stimulation of the PW at 20 ms interval (PW–PW20ms). The grey-shaded rectangles indicate the time windows used for quantification of the early (8–18 ms) and late (19–39 ms) components of the sensory responses. Note that for PW–PW20ms the two analysis time windows refer to the early and late responses evoked by the second PW deflection. PW deflection was always performed with a velocity of 800 deg s−1. The ordinate of the PSTHs (spikes per 30 stimuli per bin) refers to the number of spikes accumulated within each 1 ms bin with repetition of 30 identical stimuli. The arrows point to the artefacts resulting from the voltage step needed to move the piezoelectric actuator.
