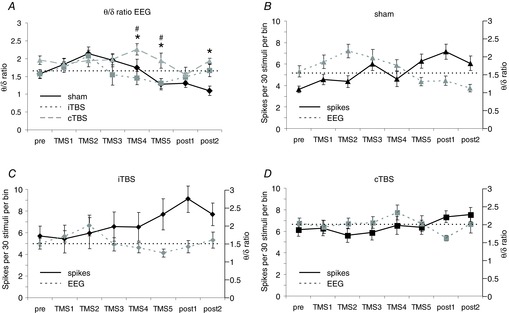
Figure 4. No correlation between changes in spectral power of the EEG and sensory response rates.

A, means (±SEM) of the ratio of the power of the theta and delta frequency band of the EEG (θ/δ ratio) for the different time points (pre to post2) of the three experimental conditions. B–D, comparisons of changes in EEG power ratio with changes of sensory response spike rates (PW early response) for the different experimental conditions (B, sham; C, iTBS; D, cTBS). The dotted horizontal line gives a reference to the ‘pre’ θ/δ power ratio of the EEG. Statistically significant differences (P < 0.05) are shown between cTBS and sham condition (*) or between cTBS and iTBS (#, post hoc Tukey test).
