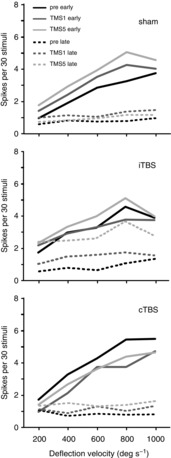
Figure 5. No TMS effect on response gain.

For each of the three experimental conditions (sham, iTBS, cTBS) the diagrams show mean early (continuous lines) and late (dashed lines) response rates evoked by five different whisker deflection velocities during the pre (black), TMS1 (dark grey) and TMS5 (light grey) conditions. The error bars were excluded here for better readability of the diagrams. Both iTBS and cTBS mainly induced vertical shifts of the curves without a change in slope. While early response components showed a clear stimulus–response relationship, late responses did not except when strongly increased after the fifth iTBS block. Only at deflection velocities of 800–1000 deg s−1 did varying response saturation change the slope of the curves.
