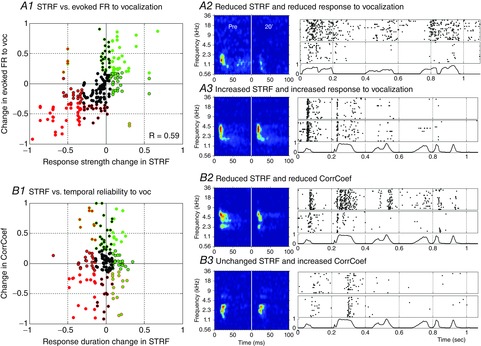
Figure 5. Relationship between NA effects on STRFs and on responses to vocalizations.

Scattergrams displaying the normalized NA effect on the STRF parameters vs. on parameters obtained from response to vocalizations. A1, the response strength during the STRF is plotted against the evoked firing rate in response to vocalizations. B1, the duration of the STRF is plotted against CorrCoef (which quantifies the spike timing reliability). In both cases, normalization between values in control conditions and 20 min after NA application is used: (value 20 min – control value)/(value 20 min + control value). The colour code corresponds to values inferior to the first quartile (red) or superior to the third quartile (green). The colour of the dot centre refers to the parameters extracted from the STRFs; the colour of the contour refers to the parameters extracted from responses to vocalizations. A2–3 and B2–3, examples of STRFs and rasters of response to vocalizations for the same recording site in control condition (Pre) and 20 min after application. The normalized vocalization intensity as a function of time is presented below the rasters. A2, example of a decrease in response strength and in evoked firing rate. A3, example of an increase in response strength and in response to vocalization. B2, example of a decrease in STRF duration and in CorrCoef. B3, example of an unchanged STRF duration and an increase in CorrCoef. The scattergrams and the individual examples show clearly that the NA effects on firing rate during STRFs and responses to vocalizations are strongly correlated (R = 0.59, P < 0.05), whereas the NA effects on STRF duration are not correlated with the temporal reliability of responses to vocalizations (R = 0.03, P = 0.69).
