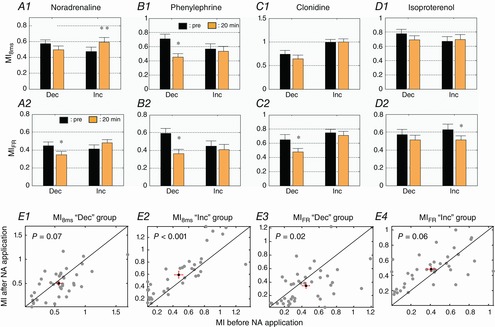
Figure 6. Effects of NA and its agonists on mutual information for the largest increases and the largest decreases in response to vocalization.

Based upon the first and last quartile of the distribution of the evoked firing rate variations (displayed in Fig. 4A1), two populations were identified: the strongest increases (Inc) and the strongest decreases (Dec). The mutual information (mean ± SE) based on firing rate (MIFR) and on temporal patterns (MI8ms) was quantified after NA (A1, A2), phenylephrine (B1, B2), clonidine (C1, C2) and isoproterenol (D1, D2) application. Scatterplots of the MI8ms (E1–2) and MIFR (E3–4) values before and after NA application are displayed for the ‘Inc’ and ‘Dec’ groups. Each grey dot represents a pair of MI values. In each scattergram, the black dot represents the mean values of MI before and after NA application; red bars represent the standard error. *Significant difference from control conditions (P < 0.05, paired t test). **Significant difference from control conditions (P < 0.005, paired t test). Cortical sites with increased evoked firing rate after NA application display increased discrimination abilities based on temporal patterns (MI8ms), an effect not replicated by the noradrenergic agonists.
