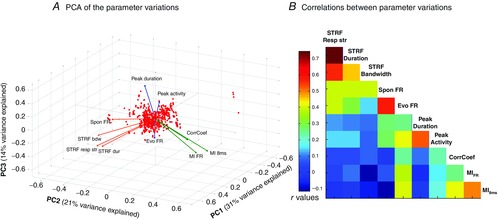
Figure 8. PCA for the NA-induced effects on STRF and responses to vocalizations.

A, plot of the three first principal components of the PCA of the effect induced by NA application. These three components explain 31, 21 and 14% of the variance, respectively. Observations are represented as red dots and variables as coloured vectors (see Methods for details). The effect of NA analysed for each parameter corresponds to the value of a given parameter 20 min after application minus the value before application. Three clusters of parameters emerged: (i) the parameters extracted from STRFs and spontaneous firing rate (orange vectors), (ii) MIFR, MI8ms and CorrCoef (green vectors) and (iii) evoked firing rate, peak duration and peak activity (blue vectors). Note that the vector colours are illustrative and are not the result of mathematical clustering. B, correlation matrix of the effect induced by NA application. The correlation matrix confirms the PCA results: parameters extracted from STRFs are highly correlated, parameters indexing temporal reliability and information are highly correlated, and firing rate during the entire vocalizations vs. firing rate during the PSTH peaks are highly correlated.
