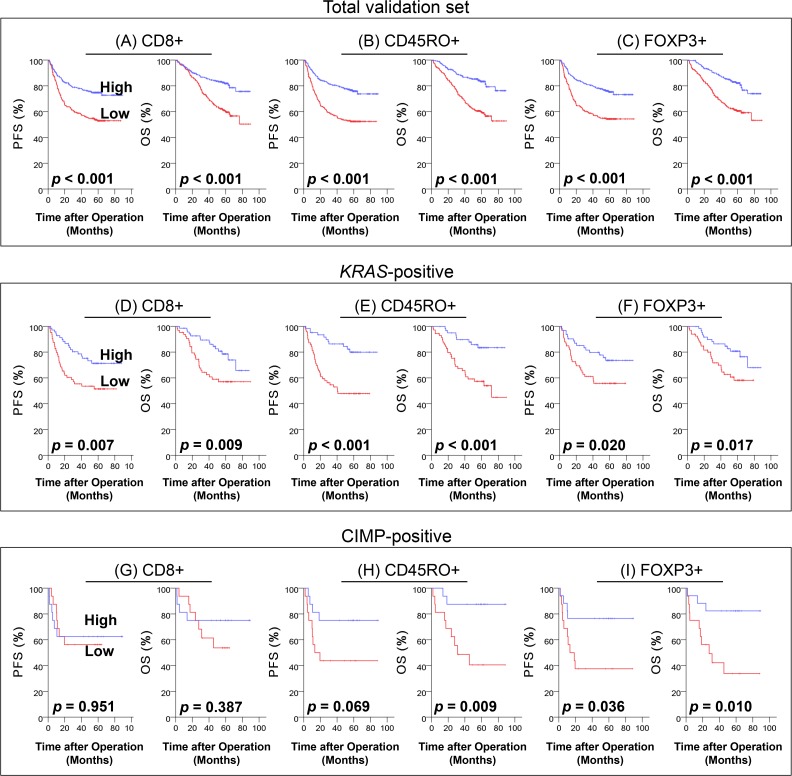
Fig 5. Progression free survival (PFS) and overall survival (OS) in the validation set of CRC.
Kaplan-Meier curves showing the prognostic significance of CD8 (A, D and G), CD45RO (B, E and H), and FOXP3 (C, F and I) densities in invasion front from total CRC (A to C) (n = 549), KRAS-mutated (D to F) (n = 141), and CIMP-positive (G to I) (n = 36) patients

