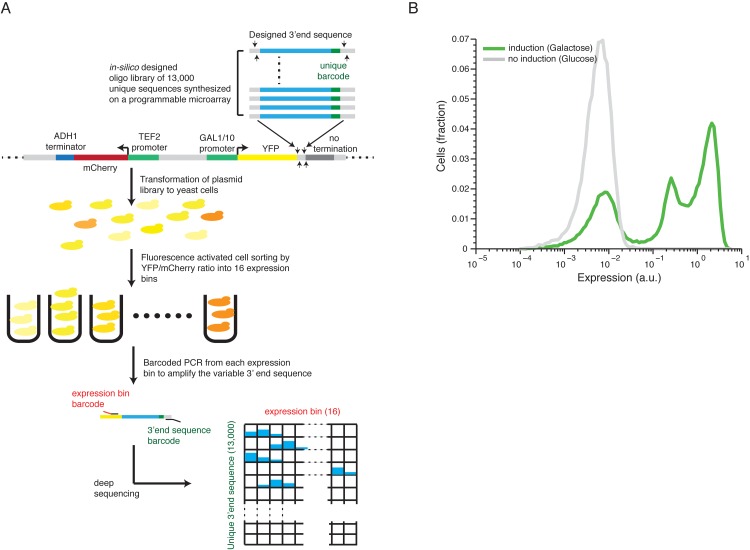
Fig 1. Illustration of our method and overall expression distribution.
(A) 13,000 designed synthetic sequences were ligated into a low copy plasmid (top part). The plasmid pool was then transformed into yeast to create a heterogeneous pool of yeast cells each expressing YFP to a different level corresponding to one of the unique 13,000 cloned 3’ end sequences. The cells were then sorted using fluorescence activated sorting (FACS) into 16 expression bins by the YFP/mCherry ratio (middle). Next, the reporter 3’ end sequences of cells in each bin were amplified, using bar coded primers for each bin, and sequence barcodes was recovered using next-generation sequencing (NGS). Finally, each sequencing read was mapped to a specific 3’ end sequence and a specific bin (bottom) to achieve the distribution of cells with each synthetic 3’ end sequence across the expression bins. The distribution of each construct was fit to a gamma distribution and the mean expression value was inferred based on this fit. (B) The distribution of library expression values in induced and un-induced promoter states. The induced state displays a tri-modal distribution with 3 peaks corresponding to (1) non-induced promoter state (2) induced promoter state and low expressing 3’ end sequences and (3) induced promoter state with a wide range of 3’ end mediated expression.

