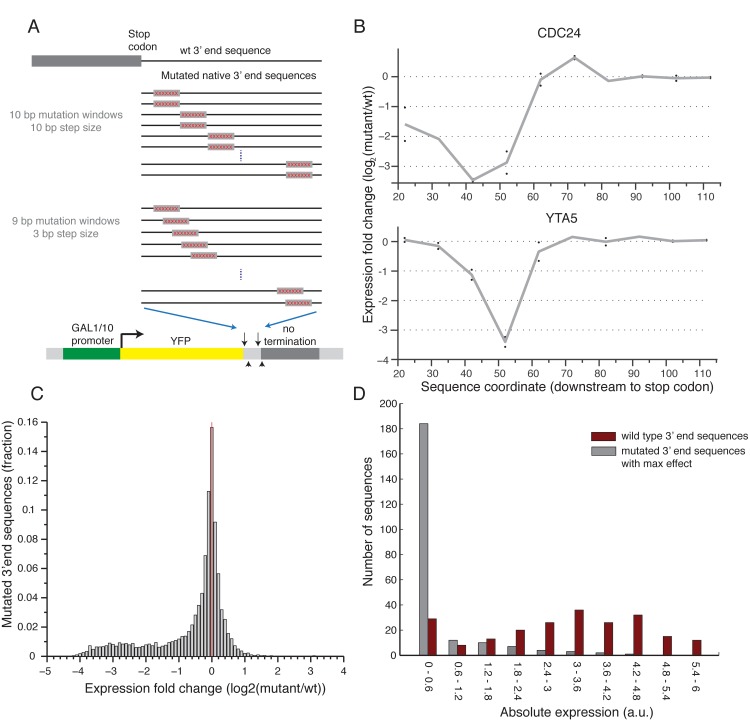
Fig 2. Scanning mutagenesis of native 3’ end sequences reveals critical elements required to maintain expression.
(A) Illustration of the two scanning mutagenesis strategies used, in the upper panel two 10bp mutation windows were designed with non-overlapping 10bp steps. In the lower panel 9bp mutation windows were designed with overlapping 3bp steps. (B) Profile of the effect of mutations as a function of location for two genes: CDC24 and YTA5. Y-axis shows the expression log2 fold change compared to the wild type sequence with each point representing a single 10bp mutation window centered around the corresponding x-axis value relative to the stop codon. The gray line connects the average of each pair of mutations. (C) Distribution of log2 fold ratio between mutated and wild type 3’ end sequences showing a highly skewed distribution towards negative values. (D) Distribution of absolute expression values (a.u.) for non-mutated native 3’ end sequences (dark red) and mutated 3’ end sequences (gray). For the mutated sequences, the mutation that resulted in the largest reduction in expression was chosen for each native sequence.

