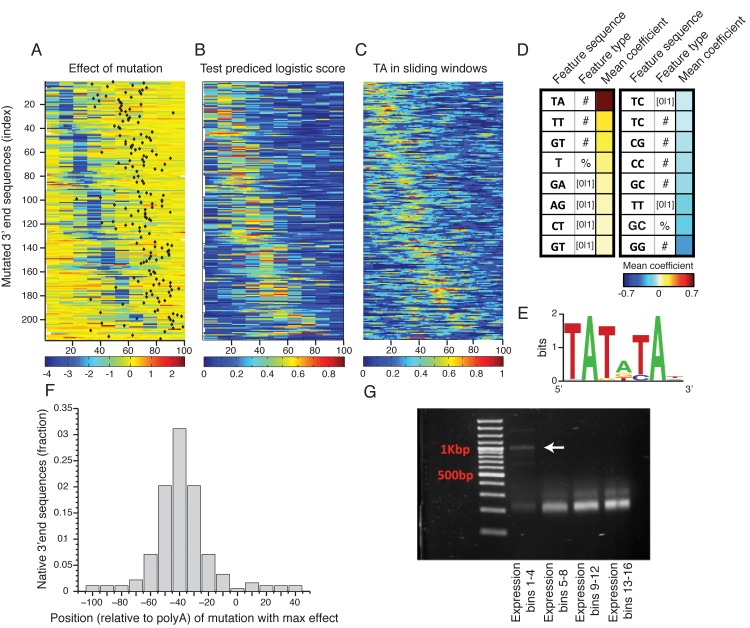
Fig 3. Sequence determinants of 3’ end functional elements.
(A) Heat map showing the mean effect of a mutation as a function of location in the 3’ end sequence. Each row represents one sequence and the color represents the mean expression fold change across two replicates between the mutated and wild type sequences. Rows are sorted by the location of the maximal affecting mutation. (B) Heat map of predicted logistic values on a held-out test set (see main text and methods). Location of subsequences correspond to those in Fig 3A. (C) Frequency of AT dinucleotide, highest weighted feature in the inferred model, in sliding windows of 20bp. Location of subsequences correspond to those in Fig 3A. (D) Table of the features that contribute most to the classification. Color represents the mean coefficient across the 10 cross validation partitions. For each possible mono/di-nucleotide three types of features were considered: ‘[0|1]’ – a binary feature that is one if the specified mono/di-nucleotide occurs at least once in the sequence and zero otherwise, ‘#’ – a counter of the number that the specified mono/di-nucleotide occurs in the sequence. ‘%’ percent of nucleotides of the sequence that are part of an occurrence of the specified mono/di-nucleotide. (E) DNA sequence motif found to be enriched in the positive subsequence instances. (F) Distribution of distances between the location (center) of the mutation that resulted in the maximal reduction in expression and the location of the main polyadenylation site for the wild type sequence. (G) Results of YFP specific 3’ RACE, where each lane represents 4 expression bins. Lowest lane displays long aberrant 3’UTRs not apparent in the higher expression bins.

