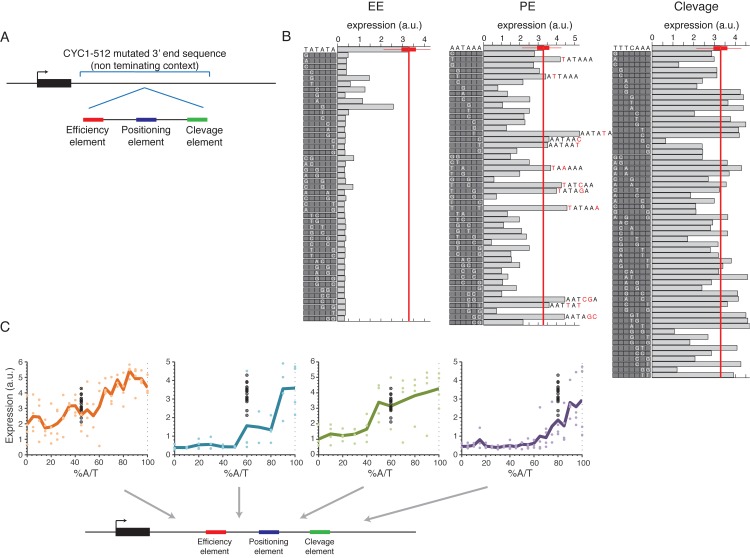
Fig 5. Systematic mutagenesis of a designed synthetic terminator.
(A) Illustration of the construct design: a minimal terminator sequence was embedded within a mutated non-terminating 3’ end sequence from the CYC1-512 3’ end region. (B) All possible single bp mutations in the three elements EE, PE and cleavage on the left, middle and right panels, respectively. Boxes on the left of each panel show the mutated sequences with a highlighted white letter representing the location and exact mutation relative to the wild type sequence shown on the top. Bars show the expression value of each sequence. (C) Expression as a function of context A/T content. Each point represents a mutated sequence with A/T content of the relevant sequence region on the x-axis and expression on the y-axis. Black points show the expression of the non-mutated sequence with different barcodes. Mutated regions are: (1) upstream to EE (2) between EE to PE (3) between PE to cleavage and (4) downstream to cleavage, corresponding to the panels from left to right.

