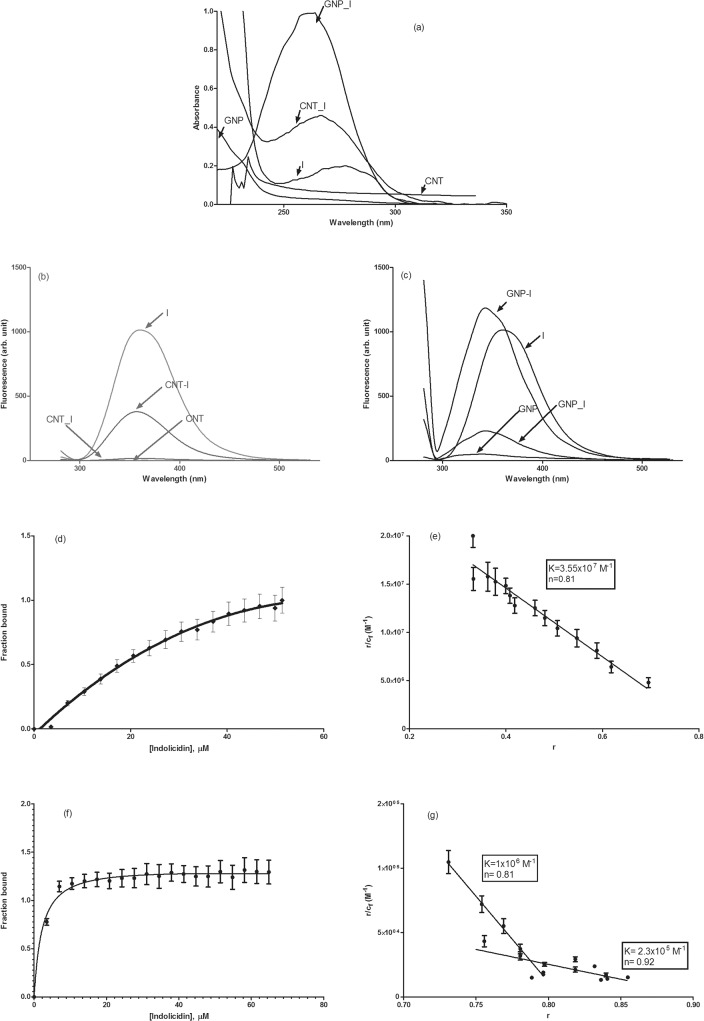
Fig 2. Absorbance and fluorescence spectra and binding isotherm.
Representative (a) absorbance spectra of free indolicidin (I), free CNT, free GNP, CNT conjugated I (CNT_I) and GNP conjugated (GNP_I) indolicidin and fluorescence spectra of (b) free CNT, CNT-I, free I and free CNT spiked with indolicidin and of (c) free GNP, GNP-I, free I and free GNP spiked with indolicidin are shown. Spectra are labeled in the panels for easy identification. Binding isotherm of indolicidin with CNT and GNP. Fraction of indolicidin bound with (a) CNT and (c) GNP and Scatchard plot of binding of indolicidin with (b) CNT and (d) GNP are shown. Panels (b) and (d) also listed the values of association constant and stoichiometry of binding. Standard deviations of the data are shown as error bars in the figure.

