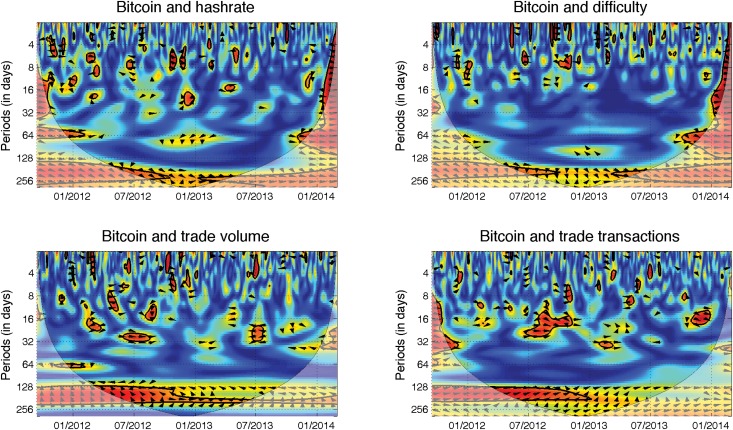
Fig 3. Currency mining and trade usage.
The descriptions and interpretation of relationships hold from Fig 2. Both the hash rate (top left) and difficulty (top right) are positively correlated with the Bitcoin price in the long-term. The price leads both relationships as the phase arrow points to southeast in most cases, and the interconnection remains quite stable in time. The trade volume (bottom left) is again connected to the Bitcoin price primarily in the long-term. However, the relationship is not very stable over time. Until 10/2012, we observe a negative correlation between the two, and the price is the leader. The relationship then becomes less significant and the leader position is no longer evident. For the trade transactions (bottom right), the relationship is positive in the long-term, and the transactions lead the Bitcoin price. However, the relationship becomes weaker over time, and it is not statistically significant from 01/2013.

