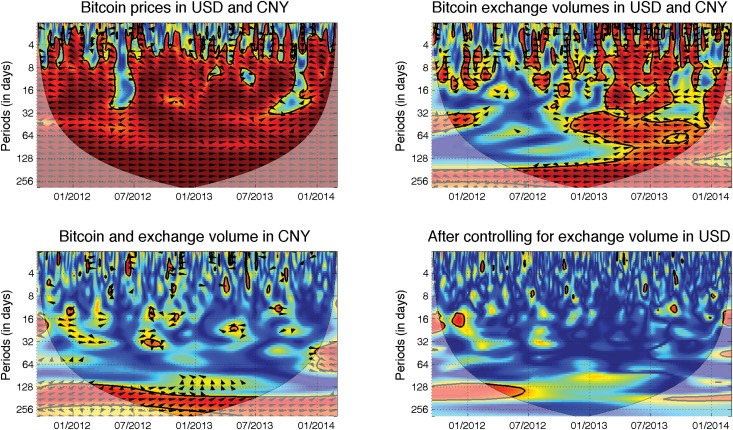
Fig 5. Influence of the Chinese market.
The description and interpretation of relationships hold from Fig 2. Bitcoin prices in USD and CNY (top left) move together at almost all scales and during the entire examined period. There is no evident leader in the relationship, though the USD market appears to slightly lead the CNY at lower scales. However, at the lowest scales (the highest frequencies), the correlations vanish. For the volumes (top right), the two markets are strongly positively correlated at high scales. However, for the lower scales, the correlations are significant only from the beginning of 2013 onwards. There is again no dominant leader in the relationship. The CNY exchange volume then leads the USD prices in the long run (bottom left). However, when we control for the effect of the USD exchange volume (top right), we observe that the correlations vanish.

