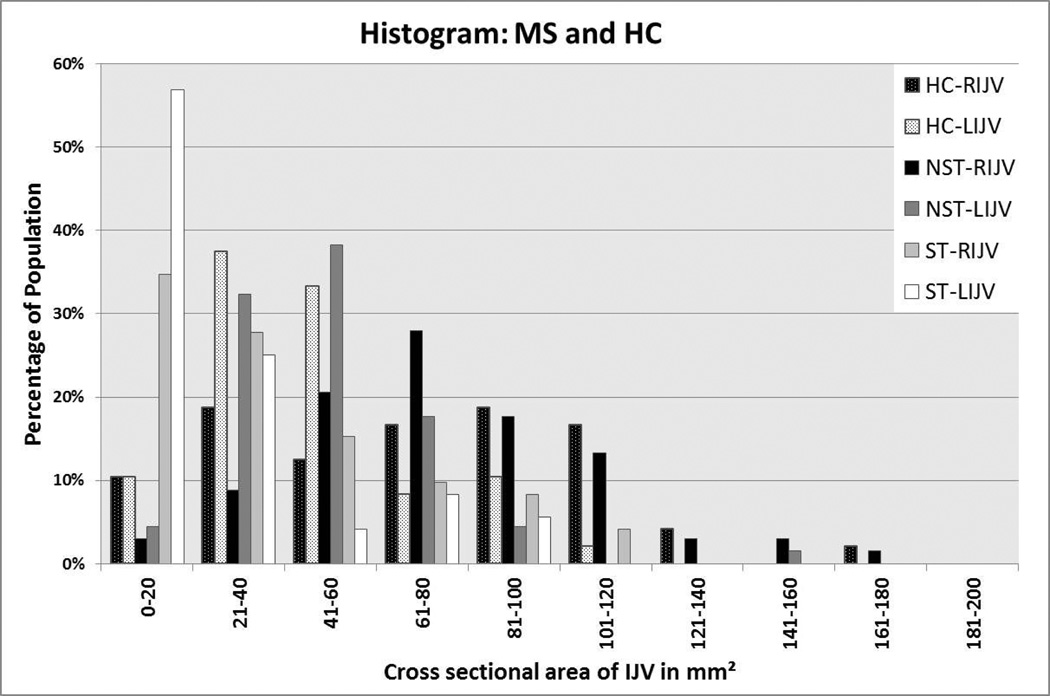
Figure 4.
Histogram of RIJV and LIJV for MS and HC groups showing the percentage of those samples within the given CSA ranges. This data set comes from the C5/C6 neck level using 2D TOF MRV (and if no signal was present, then the 3D CE MRAV was used). There are 48 cases here as 19 did not have venography collected.

