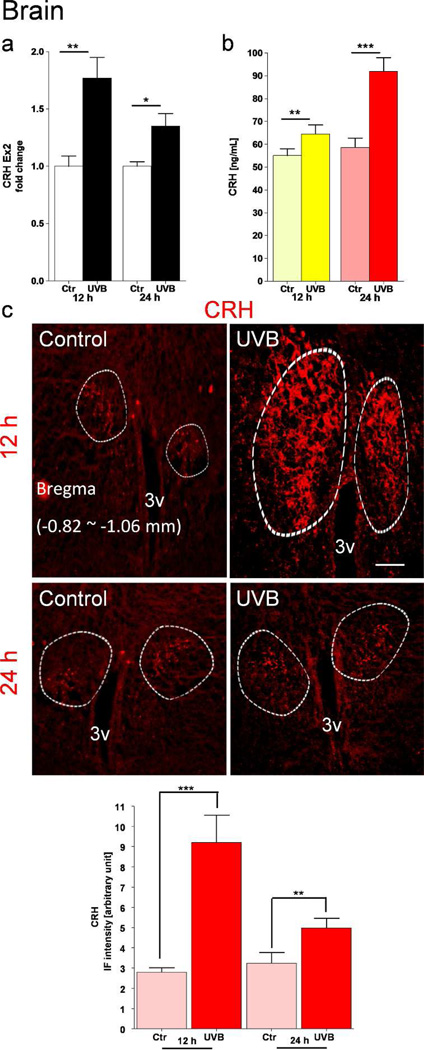
Figure 4.
Up-regulation of CRH expression in the murine hypothalamus after exposure of shaved back skin to UVB. CRH gene expression is shown as fold change ± SD (a). CRH peptide was measured by ELISA (b). Data are presented in pg/mL in relation to the same protein concentration (28 µg/µL). CRH immunoreactivity in situ in the PVN was evaluated by immunofluorescence (c). Circled areas show in situ localization of CRH antigen visualized in perikarya and nerve fibers. Calculation of positive signals intensity is presented on the graph in the lower panel c. Data are analyzed using t-test, * p<0.05, ** p<0.01, and *** p<0.001. Scale bar = 100 µm.

