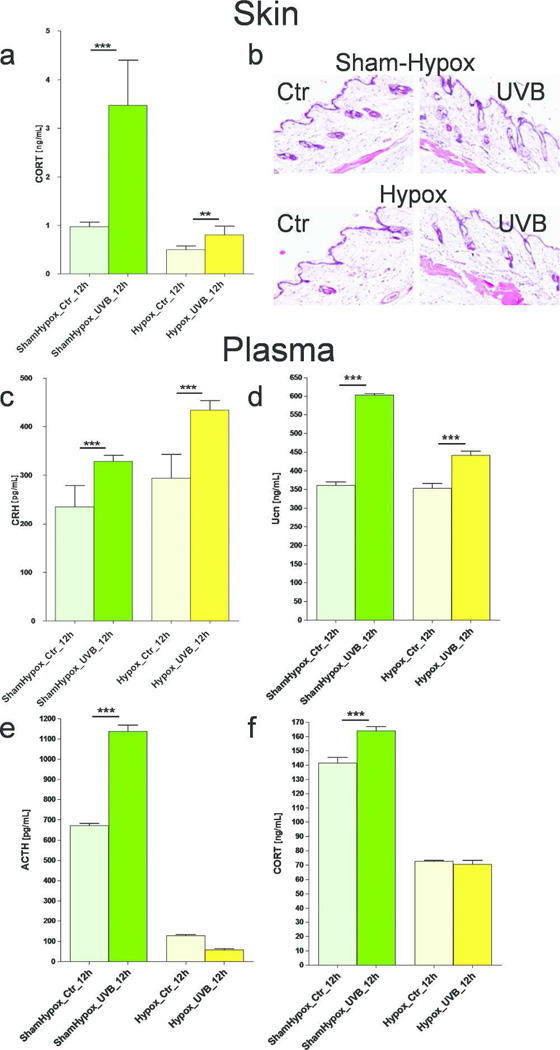
Figure 6.
Differential effects of UVB on the HPA axis in hypox (pituitary removed) and sham-hypox (pituitary intact) C57BL6 mice. CORT levels were evaluated with ELISA and presented as ng/mL after adjustment of total protein content to 4 µg/µL (a). Comparison of histological evaluation between hypox and sham-hypox mouse skin after UVB (400 mJ/cm2) exposure (b). Plasma levels of peptide CRH (c), Ucn (d), ACTH (e) and CORT (f) after exposure of shaved back skin to UVB. Data presented as pg or ng/mL after prior dilution performed separately for each assay, and analyzed using t-test, ** p<0.01, and *** p<0.001.

