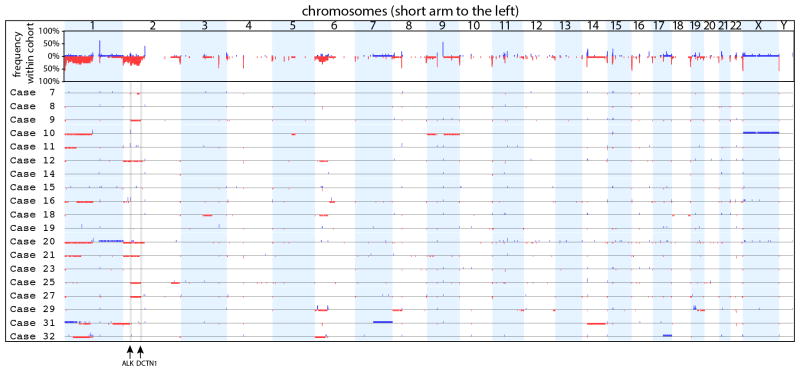
Figure 3. Overview of CGH results.
The top panel shows the frequency of copy number changes at each genomic position of the entire cohort indicating recurrent losses of chromosomes 1p, 2p and 6p. The rows below show the individual cases along the same axis. Red regions below the axis represent areas of loss. Blue regions above the axis represent areas of gain. Amplifications defined by regions with a log2 ratio >1.5 are shown as areas with a higher blue block. The genomic positions of ALK and DCTN1 are noted at the bottom. Cases 9, 25, and 27 demonstrate deletion of the region of 2p between ALK and DCTN1 suggestive of a DCTN1-ALK fusion.

