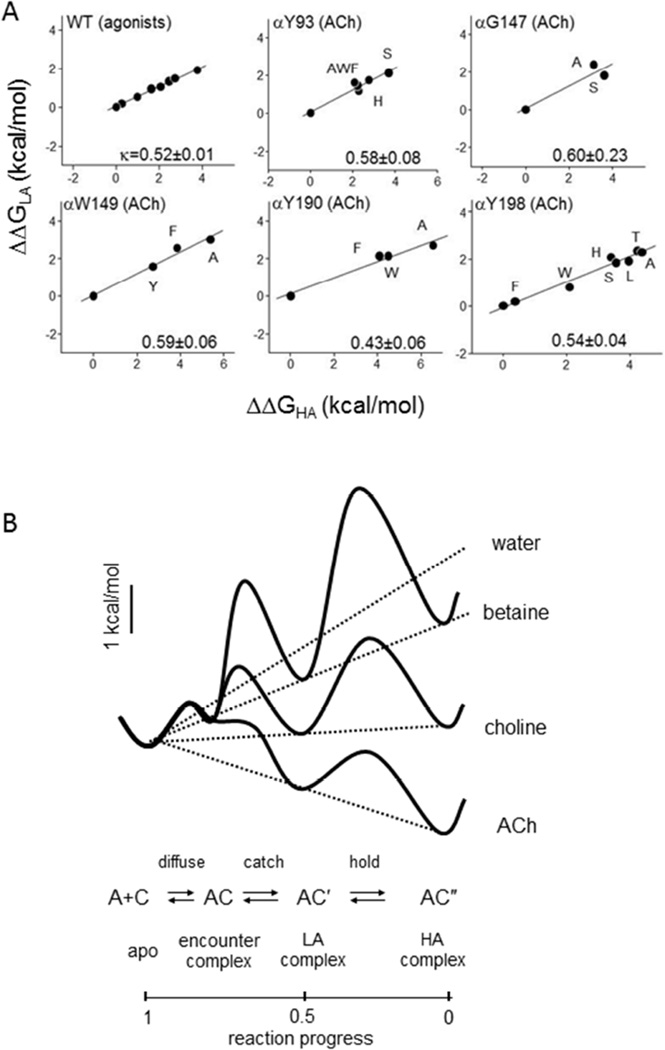
Figure 4. Catch-and-hold.
A. Low- and high-affinity binding are correlated linearly for different agonists and binding site mutants (values normalized to ACh, WT). A slope (kappa) of 0.5 indicates for all of the perturbations, ΔΔGHA≈2ΔΔGLA. B. Catch-and-hold energy landscape. Plots of free energy vs. reaction progress for water three different agonists. The agonist ‘tilts’ the overall chemical potential profile, to reduce the barrier heights and increase the forward catch and hold rate constants. For ACh, formation of the LA complex is almost diffusion-limited. LA and HA energies are coupled obligatorily (dotted lines).

