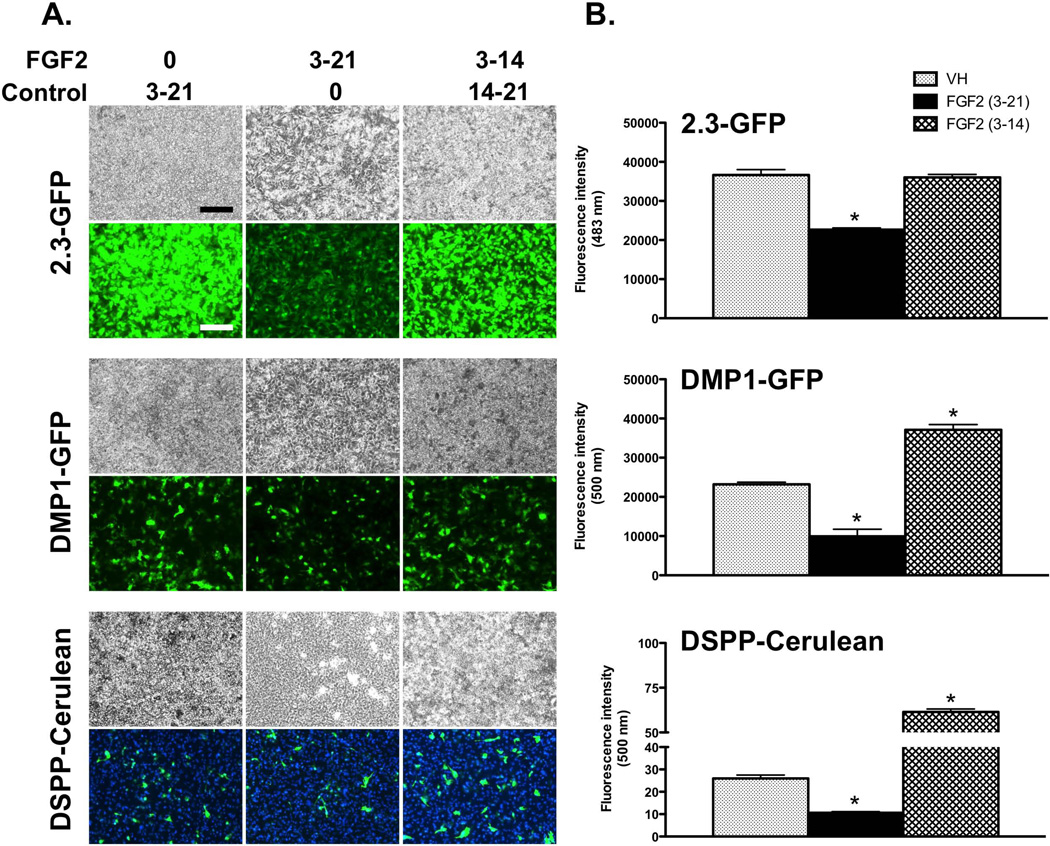
Figure 5. Effects of withdrawal of FGF2 on the expression of GFP transgenes in primary dental pulp cultures.
(A) Representative images of the same areas in cultures analyzed under brightfield and epifluorescent light using appropriate filters at day 21. DSPP-Cerulean was detected with anti-GFP antibody by immunocytochemistry and examined using filter for GFPtpz. The epifluorescent image represents Hoechst/GFP overlay. The magnifications of all micrographs are identical. Scale bar = 200 μm.
(B) Histograms showing the effects of withdrawal of FGF2 on the expression of various transgenes at day 21. Results in all histograms are expressed in absolute values and represent mean ± SEM of at least three independent experiments; *p ≤ 0.05 relative to VH. Note that after withdrawal of FGF2 the intensity of the expression of 2.3-GFP reached that in control, and the intensity of DMP1-GFP and DSPP-Cerulean exceeded that in control.

