
Figure 1. RNA sequencing in autophagy-dependent and independent breast cancer cell lines.
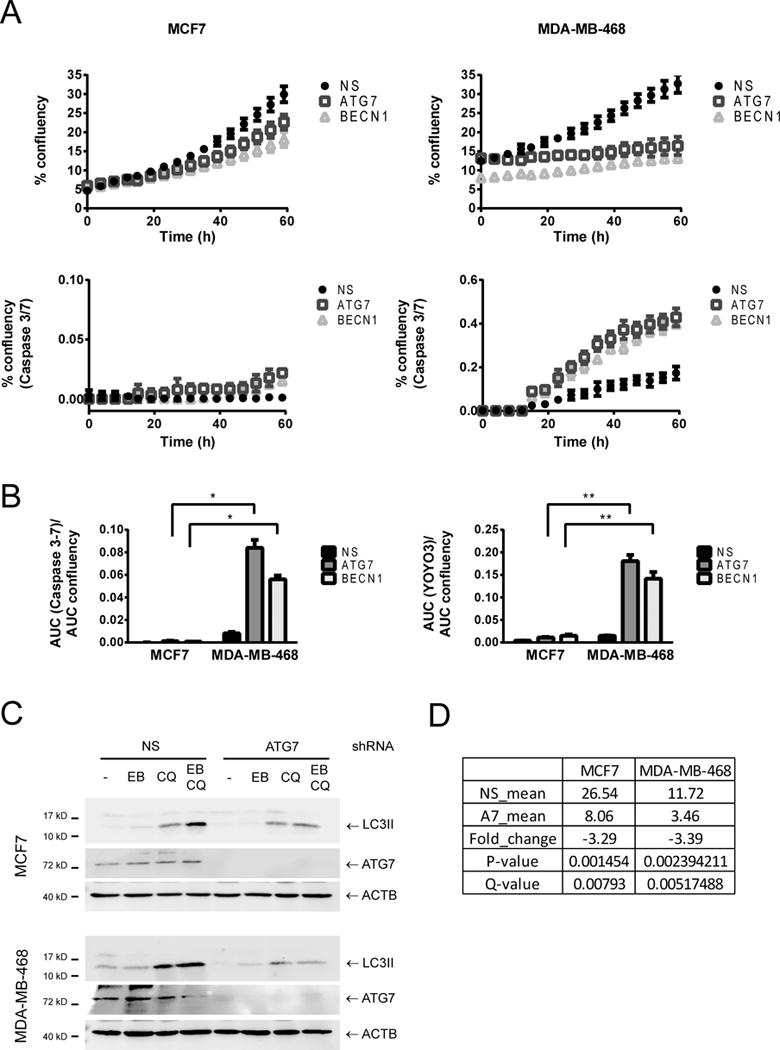
MCF7 and MDA-MB-468 cells were transduced with lentiviruses containing shRNAs for ATG7 or BECN1. Proliferation (% confluency in time lapse images), caspase activation (% confluency of a Caspase 3–7 substrate with green fluorescence) and total cell death (% confluency of YOYO3 red fluorescence in the same images) were measured in an Incucyte imaging system for 60 hours. In A, a representative curve of one out of three experiments performed in triplicate is shown. In B, the area under the curve (AUC) of either green % confluency (for caspase 3–7 activity) or red % confluency (for total cell death measured with YOYO3) was normalized to the AUC of the proliferation curve for normalization to cell number. Comparison of autophagy deficient (expressing ATG7 or BECN1 shRNAs) MDA-MB-468 cells with MCF7 cells shows a significant increase in cell death in MDA-MB-468 when compared to MCF7 cells in response to autophagy inhibition. * = p < 0.001, ** = p < 0.0001. In C, Western blot analysis of matched protein samples from the RNA samples sent for sequencing is shown. ATG7 shRNA decreased starvation-induced autophagy in both cell lines. Cells were treated with EBSS (EB), 20 μM chloroquine (CQ), or EBSS+CQ (EB CQ) for 2 h and collected for Western Blot. In D, the levels of ATG7 mRNA found in the RNA sequencing results are shown. The Table compares the mean value of the non-silencing (NS_mean) versus the ATG7 replicates (A7_mean).