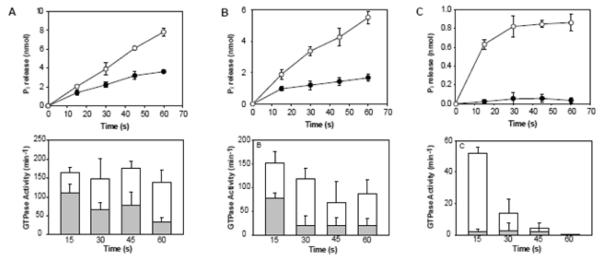
Figure 3. Stimulation of the GTPase activity of Dyn2 by Arc.

Top panels show the time courses of GTP hydrolysis catalyzed by 1 μM Dyn2 in the absence (●) or presence (○) of 1 μM Arc, measured at 37°C in buffer containing 50 mM NaCl (A), 75 mM NaCl (B), or 100 mM NaCl (C). Bottom panels show the decrease in specific activities at each NaCl concentration over 1 min time courses in the absence (shaded bars) or presence (open bars) of Arc. Each bar represents the activity measured over the 15 seconds prior to the times designated on the abscissa. Less than 10% of substrate (GTP) was depleted in all measurements. Data represent the mean +/− SD of triplicate measurements from two experiments.
