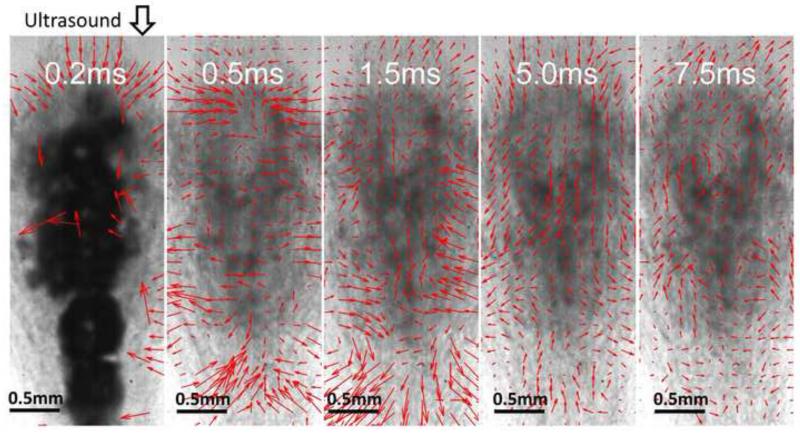
Figure 10.
Representative PIV estimations overlaid with the corresponding optical images taken after the 100th histotripsy pulse. These images were taken in the axial-lateral plane of the transducer, and the histotripsy pulses propagated from the top to the bottom of the field. At 0.2 ms after the pulse, the cavitation bubbles show and no coherent motion is detected. At 0.5 ms, coherent motion is forming and pushing away from the transducer in the majority of the focal area proximal to the transducer and another stream of coherent motion at the distal side is moving towards the transducer. At 1.5 ms, the coherent motion at the proximal side is rebounding back and the coherent motion at the distal side is rebounding away. The motions repeat at 5 ms and 7.5 ms as in 0.5 and 1.5 ms.

